Section πŸ“¦ Structures

A structure in MATLAB is a flexible data type that lets you bundle related but differently-typed pieces of dataβ€”numbers, strings, arraysβ€”under a single object. Each piece of data is stored in a field, and you access it using the field’s name.
For further details, see the official MATLAB documentation: struct.

Subsection Structure Basics

Suppose S is a structure. It contains fields (names) and corresponding values (data). Think of each field as a β€œsub-variable” inside S that holds information about S. The value is the actual information stored in that field.
There are two common ways to create a structure:
Method 1: Use the struct command (field names in quotes):
S = struct('field_1', value_1, 'field_2', value_2, 'field_3', value_3)
Method 2: Use the dot selector (field names as identifiers):
S.field_1 = value_1
S.field_2 = value_2
S.field_3 = value_3
Variant with quoted field names: useful when the field name comes from a variable or is built dynamically.
S.('field_1') = value_1
S.('field_2') = value_2
S.('field_3') = value_3
You only need the quoted form when all or part of the field name is stored in a variable or constructed at runtime:
fname = 'field_1';
i = 3;
S.(fname) = value_1;                 % same as S.field_1 = value_1
S.(['field_' num2str(i)]) = value_3; % same as S.field_3 = value_3
Each method above produces the same structure layout.
Using these methods, define structures person_1, person_2, and person_3 with fields Name, Age, and Height (in feet) as shown below.
Variable Name Age (yrs) Height (ft)
person_1 Alice 25 5.68
person_2 Ben 32 4.90
person_3 Sunil 18 6.14
% Build three structures using different techniques
person_1 = struct("Name","Alice","Age",25,"Height",5.68);

person_2.Name = "Ben";
person_2.Age = 32;
person_2.Height = 4.90;

var1 = "Age";  var2 = "Hei";  var3 = "ght";
person_3.("Name") = "Sunil";
person_3.(var1) = 18;
person_3.([var2 var3]) = 6.14;

% View Structures and their contents:
person_1
person_2
person_3
Access values with the dot selector:
person_1.Age
person_2.Name
person_3.Height

Example 3. Summarize a Numeric List.

Write a function that takes a row vector of numbers and returns a structure with basic summary information.
name size type description
inputs: 1xN double row vector of numbers
outputs: 1x1 struct structure with fields n, m, M, sorted
  • n (int): number of values
  • m (double): minimum value
  • M (double): maximum value
  • sorted (logical): true (1) if the list is nondecreasing; otherwise false (0)
function list_info = get_list_info(list)
	% set n
	n = length(list);

	% initialize m, M, & sorted
	m = list(1);
	M = list(1);
	sorted = true;

	% determine m, M, & sorted
	for k = 2:length(list)
		% update m?
		if list(k) < m
			m = list(k);
		end
		% update M?
		if list(k) > M
			M = list(k);
		end
		% update sorted?
		if list(k-1) > list(k)
			sorted = false;
		end
	end

	% create the list_info structure
	list_info.n = n;
	list_info.m = m;
	list_info.M = M;
	list_info.sorted = sorted;
end
Test the function.
list_info_1 = get_list_info([-11.02 5.3 -2.0 5.3 4.09 5.3])
list_info_2 = get_list_info([1 1 1 1 1 1 1 1])
Example 4. Car Data.

Task 1: Load the data.
car_data = load('carbig.mat');
Task 2: Explore the data.
What type is car_data?
class(car_data)
What are the fields of car_data?
fields(car_data)
Display the values in the model and year fields (side by side):
disp([car_data.Model, num2str(car_data.Model_Year)])
How many cars are in the data set?
n_cars = length(car_data.Model)
Task 3: Print a list of models.
Write a function that, given the car data structure and a target miles-per-gallon (MPG), prints models from year 1980 whose MPG is less than the target.
name size type description
inputs: 1x1 struct MATLAB built-in car data from 'carbig.mat'
1x1 double maximum MPG threshold for year 1980
outputs: MxN char printed list of models with MPG < target (1980 only)
function print_models_below_mpg(data, target_mpg)
	% Extract the model, year, and mpg data
	models = data.Model;
	years  = data.Model_Year;
	mpgs   = data.MPG;

	% Print a header
	fprintf('1980 Car Models with an MPG under: %i \n\n', target_mpg)

	% Print desired models
	for k = 1:length(models)
		if years(k) == 80 && mpgs(k) < target_mpg
			fprintf('  Model: %20s  MPG: %6g \n', models(k,:), mpgs(k))
		end
	end
end
Test the function.
car_data = load('carbig.mat');
print_models_below_mpg(car_data, 30);
print_models_below_mpg(car_data, 25);
print_models_below_mpg(car_data, 5);

Tips and Common Pitfalls.

  • Field names must be valid identifiers unless you use the quoted form S.('field').
  • Use dynamic field names (quoted form) when constructing names at runtime.
  • Structures are great for bundling heterogeneous data; prefer tables for columnar, uniform data.

Subsection Structure Arrays

A struct in MATLAB stores heterogeneous dataβ€”numbers, text, even arraysβ€”under named fields that you access with dot notation. In this section, we focus on structure arrays: arrays whose elements are structures sharing the same field names.

Note 5.

What is a structure array?

A structure array is an array whose elements are structures with the same field names (but different values). Below we create a 1Γ—3 array of student records.
Example 6. Constructing and using a structure array.
students(1).Name = 'Alice';
students(1).ID = 101;
students(1).GPA = 3.8;

students(2).Name = 'Bob';
students(2).ID = 102;
students(2).GPA = 3.5;

students(3).Name = 'Charlie';
students(3).ID = 103;
students(3).GPA = 3.9;

% Display the array of structures
disp('Structure array "students":')
disp(students)

% Accessing fields in a structure array
disp('Accessing data from the structure array:')
disp(['Student 1 Name: ', students(1).Name])
disp(['Student 2 GPA: ', num2str(students(2).GPA)])

% Loop through the structure array
disp('Looping through the structure array to display all names:')
for i = 1:length(students)
	disp(['Student ', num2str(i), ' Name: ', students(i).Name])
end
Example 7. Practice: employees structure array.
Create a structure array employees with fields Name, ID, Position, and Salary. Add at least three entries, then loop to print each employee’s name and position.
Example 8. One possible solution.
employees(1).Name = 'John Doe';
employees(1).ID = 12345;
employees(1).Position = 'Engineer';
employees(1).Salary = 60000;

employees(2).Name = 'Jane Smith';
employees(2).ID = 12346;
employees(2).Position = 'Manager';
employees(2).Salary = 75000;

employees(3).Name = 'Alice Johnson';
employees(3).ID = 12347;
employees(3).Position = 'Analyst';
employees(3).Salary = 50000;

% Display the employee names and positions
disp('Employee names and positions:')
for i = 1:length(employees)
	disp([employees(i).Name, ' - ', employees(i).Position])
end

Library Collection.

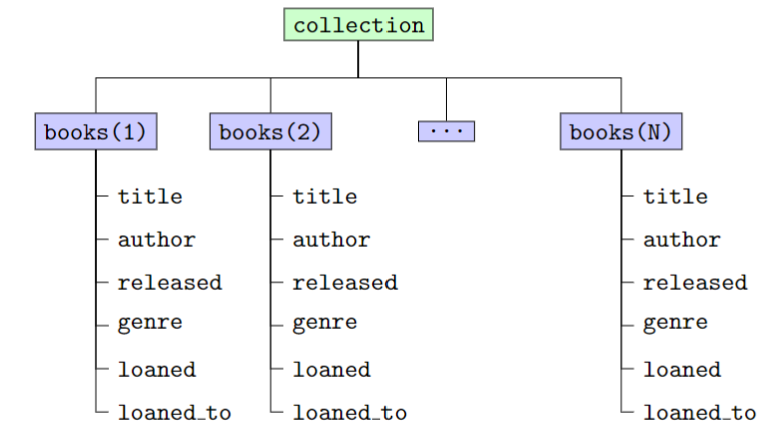
Imagine tracking a library’s collection. A top-level structure collection can hold a field books, and each entry books(k) is itself a structure with fields like title, author, released, genre, loaned, and loaned_to.
  • collection is the parent structure.
  • collection.books is a 1Γ—\(N\) struct array.
  • Access values with dot notation, e.g., collection.books(504).genre.
Figure 9.
Example 10. Adding books with dot notation and with struct.
Option 1: add book(1) using dot notation.
collection.books(1).title = 'Frankenstein';
collection.books(1).author = 'Shelly';
collection.books(1).released = 1818;
collection.books(1).genre = 'horror';
collection.books(1).loaned = true;
collection.books(1).loaned_to = 'Smith';

collection
display(collection.books)
Option 2: add book(2) using the struct constructor.
collection.books(2) = struct( ...
	'title', 'Dubliners', ...
	'author', 'Joyce', ...
	'released', 1914, ...
	'genre', 'short story', ...
	'loaned', false, ...
	'loaned_to', '');

collection
display(collection.books)

Collection of Polygons.

A polygon is formed by connecting a set of corner points \((x,y)\) with straight, non-intersecting line segments. Build a 1Γ—3 structure array polygon with fields:
  • location β€” a sub-structure with fields x_vals and y_vals (corner coordinates)
  • color β€” a fill color
  • center β€” the polygon’s center \((\bar x,\bar y)\)
Follow the tasks to preallocate, populate, and plot the shapes.
Example 11. Preallocating, populating, and plotting.
% TASK 1: Preallocate the 1x3 struct with defaults
polygon(1:3) = struct('location',[],'color','w','center',[]);

% TASK 2: define polygon(1)'s location and color
polygon(1).location.x_vals = [-2 0 1 -2 -2];
polygon(1).location.y_vals = [ 1 1 2  2  1];
polygon(1).color = 'm';

% TASK 3: define polygon(2)'s location and color
polygon(2).location.x_vals = [0 4 4 0];
polygon(2).location.y_vals = [0 0 2 0];
polygon(2).color = 'r';

% TASK 4: define polygon(3)'s location and color
polygon(3).location.x_vals = [-1  0 -1  4  3  4 -1];
polygon(3).location.y_vals = [ 3  4  5  5  4  3  3];
polygon(3).color = 'c';

% TASK 6: Call plot_shapes (defined below)
plot_shapes(polygon)
TASK 5: Complete the plotting function. It should:
  • plot and fill each polygon,
  • compute each polygon’s center (use the mean of the non-repeated vertices), and
  • label the center with the polygon’s index.
function plot_shapes(polygon)

	hold on
	% set axis range, force equal scaling, and turn grid on
	axis([-3 5 -1 6])
	axis equal
	grid on

	num_of_polygons = length(polygon);

	for k = 1:num_of_polygons
		% optional: set the x, y and color values for the current polygon
		x_vals = polygon(k).location.x_vals;
		y_vals = polygon(k).location.y_vals;
		color = polygon(k).color;

		% plot the polygon
		plot(x_vals, y_vals);

		% fill the polygon color
		fill(x_vals, y_vals, color)

		% compute the center coordinates of the polygon
		x_center = mean(x_vals(1:end-1));
		y_center = mean(y_vals(1:end-1));

		% display the index of the current polygon
		text(x_center, y_center, num2str(k))
	end

	hold off
end